At Dashbot, we are strong believers in conversational interfaces – especially voice. Conversation is the natural way humans communicate – and it’s the future of human computer interaction. As we have mentioned before, if you remember the videos of two-year-olds swiping on iPhones and iPads, the same thing is happening with devices like Alexa and Google Home – kids already know how to interact.
Last year, we conducted a survey of Alexa and Google Home users to better understand their behavior and satisfaction with the devices. 2017 was definitely the start of something big in voice. Interest in voice apps began to really take off with all types of enterprises and brands entering the space – media, CPG, retail, food delivery, banking, and a wide variety more.
This year, we re-ran the survey to see if, or how, users behaviors and feelings towards the devices may have changed in 2018. We also dove deeper into some of the interests based on demographics.
Key takeaways:
- Voice assistant devices are behavior changing
- The core features tend to be the most frequently used
- Discovery of third party voice apps is still an issue
- Users are quite likely to use the devices to make purchases
- Owners are satisfied with their devices and highly recommend them
Voice assistants continue to be behavior changing
As we saw last year, voice assistant devices are quite behavior changing. Users use them throughout the day for a variety of use cases.
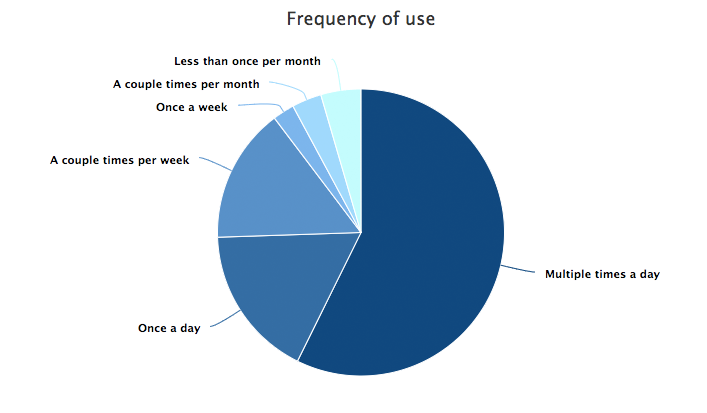
Nearly 75% of respondents use their voice devices at least once a day, with 57% using their device multiple times a day. These numbers are very similar to the results last year.
If we look closer at male versus female usage, approximately 64% of men and 53% of women use their devices multiple times a day. At the other end of the spectrum, women tend use the device less frequently with nearly 7% using the device less than once a month compared to 1.4% of men.
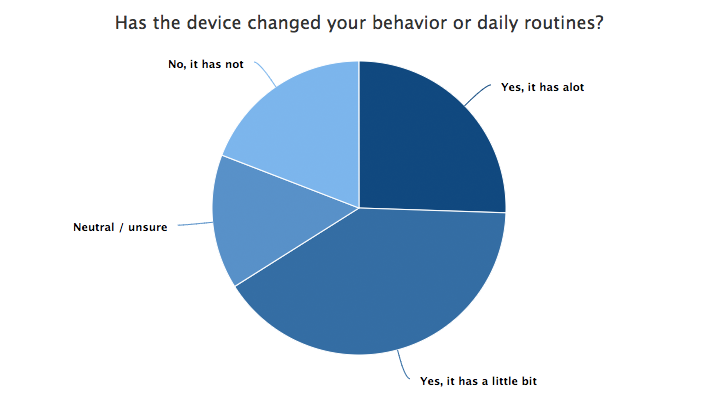
More than 65% of respondents indicated the devices have changed their behaviors or daily routines. 25.5% felt the device has changed their behavior a lot whereas 40.5% thought it has at least a little bit. Only 19% said the device has not changed their behavior.
In fact, in respondents own words they describe how much they rely on the device, how integrated it is in their life, and how surprised they are by how much they use the device.
As voice assistants become more ubiquitous, and the technology is embedded in even more types of devices, we imagine the behavior changing aspect will increase significantly. If you are a heavy Alexa or Google Home user, how often have you been traveling and catch yourself about to talk to the device in your hotel room, when it’s not there? Amazon and Google are working on this though through their business initiatives to provide devices in hotels and other locations.
Men tend to find the devices have been more behavior changing. Nearly 33% of men answered “yes, it has a lot” compared to 20% of women. As we saw with the frequency of usage, with women skewing more to infrequent usage, we also see a higher percent of women finding the device has not been behavior changing: 23.3% of women answered “no” compared to 13.7% of men.
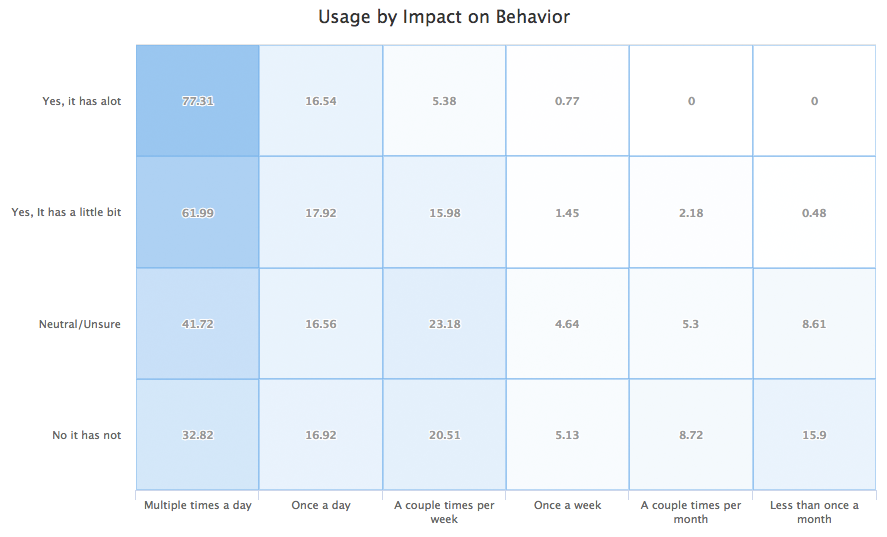
Interestingly enough, even the 19% of respondents who indicated the device has not changed their behavior, still use the device fairly regularly. Of those indicating “No,” roughly 33% still use the device multiple times a day, and another 17% use the device at least once a day.
Core features are the most frequently used
We asked respondents what features they use most frequently.
It turns out, listening to music, checking weather, and asking for information, are the most common use cases. They’re also core functionality of the devices. Using specific third party skills is less common, which we will explore later in the report.
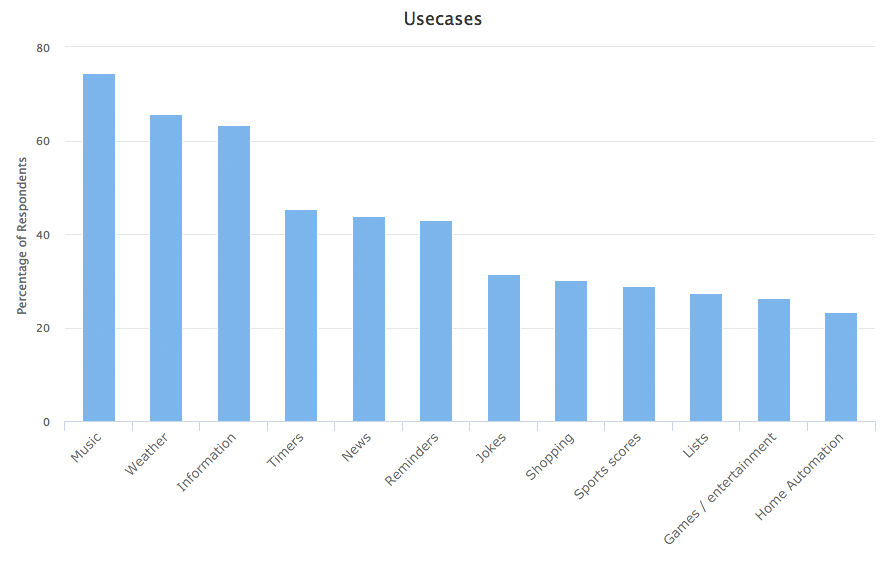
Approximately 75% of respondents use the device to listen to music, 66% check the weather, and 63% ask for information.
While listening to music and asking for information are used quite frequently, multiple times a day, weather tends to be more of a once a day activity. Approximately 58% of the respondents who listen to music, do so multiple times a day, whereas only 34% of those checking the weather do so multiple times a day – instead, 46% check once a day.
On the lower end of usage, only 23% of respondents use their devices for controlling home automation. However, those who do, do so quite frequently. Nearly 63% of respondents who use the device for home automation, do so multiple times a day, and another 22% do so at least once a day.
If we look at the usage based on gender, interesting differences emerge.
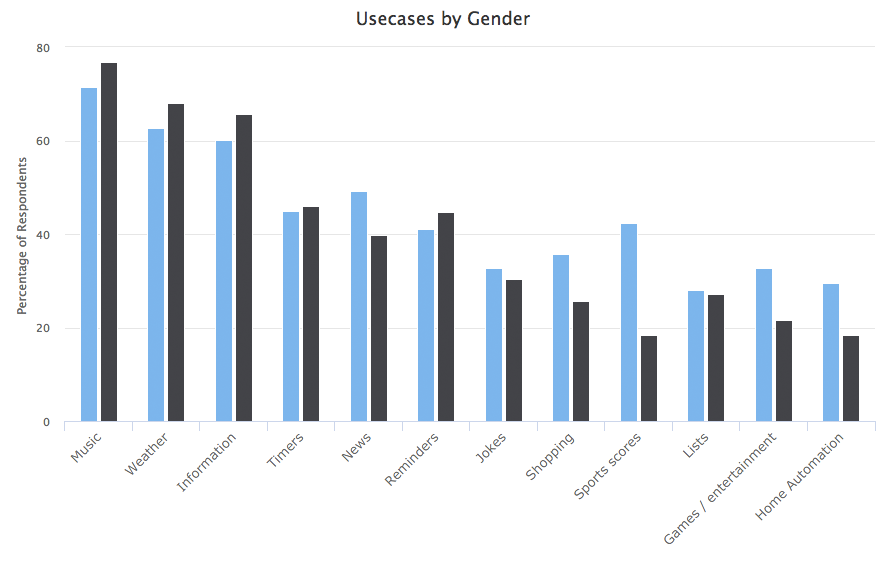
While the top three use cases are the same for both male and female, women tend to have slightly higher usage for each – roughly 5-6% higher. For example, nearly 77% of women listen to music while 71% of men do.
There are some features that men are significantly more likely to use than women. For example, nearly 42% of male respondents use the devices for sports scores compared to 18% of women. Other features include getting news (49% of men vs 40% of women), shopping (36% of men to 26% of women), playing games (33% of men to 22% of women), and home automation (29% of men to 18% of women).
Speaking of shopping, we took a closer look at this usecase.
Users are willing to make purchases through their devices
Both Alexa and Google enable users to make purchases through their own e-commerce services, and with the addition of account linking, other retailers and services. Developers and brands can also monetize their voice apps through subscriptions and “in-app” purchases.
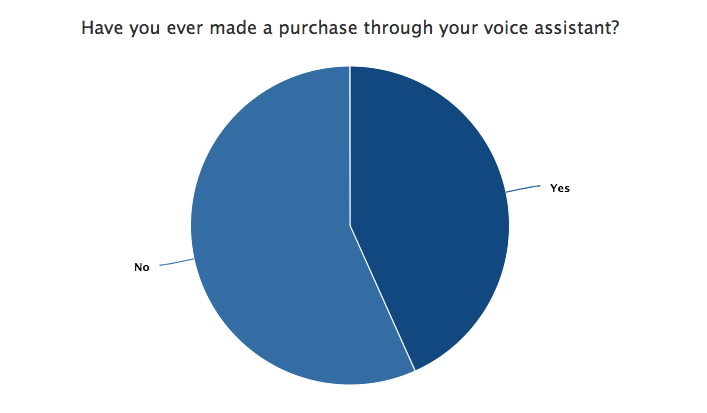
We asked respondents whether they have ever made a purchase through their voice assistant. It turns out 43% of respondents have, including 58% of men and 32% of women.
In regards to what respondents are purchasing, products from the providers own e-commerce service (Amazon or Google Shopping) are the most common at nearly 83%.
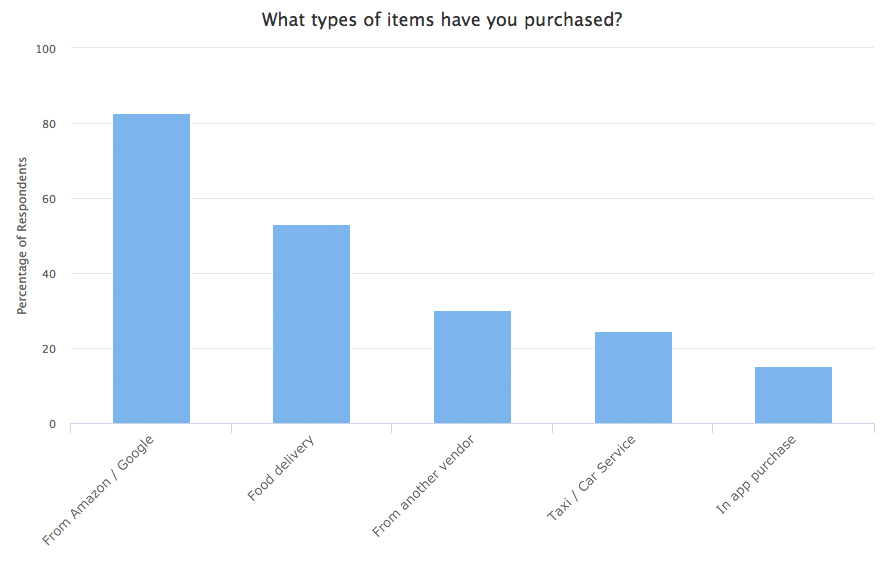
Interestingly, food delivery is also fairly common at 53%. The “reorder” case, i.e. the ability to reorder the same items as the previous order, works quite well through these interfaces, as it can be done in more shorter, concise statements than complex menu ordering. We’ve also heard from many food delivery services that reordering is quite common – consumers tend to order the same thing each time.
We also asked respondents how likely they are to make a purchase in the future. Approximately 41% are very likely to make a purchase in the future with an additional 20% likely to purchase as well.
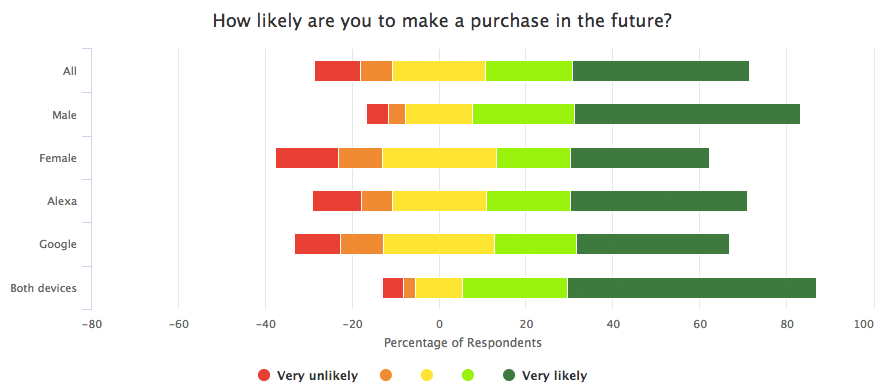
Interestingly, one of the biggest indicators of whether someone has made a purchase in the past, or is more likely to make a purchase in the future, is whether they have both an Alexa and Google Home. Over 56% of respondents who own both devices have made a purchase in the past, compared to 43% who only have an Alexa and 39% who only have a Google Home. In terms of future purchases, similarly 57% of respondents who own both are “very likely” to make a purchase in the future, compared to 41% of those who only have an Alexa and 35% who only have a Google Home. It may be that consumers who have both devices tend to be early adopters and more likely to try making a purchase through the device.
Discovery of third party voice apps is still an issue
Voice interfaces are still a relatively new space. Between Alexa and Google Home, there are approximately 50M devices in the US. In the case of Alexa, there are approximately 40,000 third-party Skills available. We found in our last survey, that many respondents did not even know the term for a third-party voice app on Alexa is a Skill, and on Google, an Action.
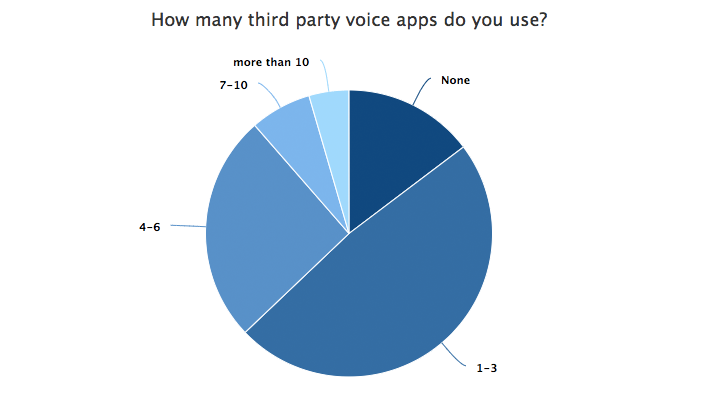
The good news is consumers are using third party skills, they just may be using a small number of them. Based on the survey, 48% of respondents use between one and three voice apps, and an additional 26% use between four and six. Only about 15% of respondents said they did not use any.
We asked respondents what their favorite voice apps are. Perhaps not surprisingly, the more common responses were the native features – listening to music, checking weather, and getting info. The more common third party apps named though include Pandora, Spotify, Uber, and Jeopardy.
Both discovery and user acquisition are challenges.
As we mentioned in our last survey, we found respondents often did not even know what the third party voice apps were called.
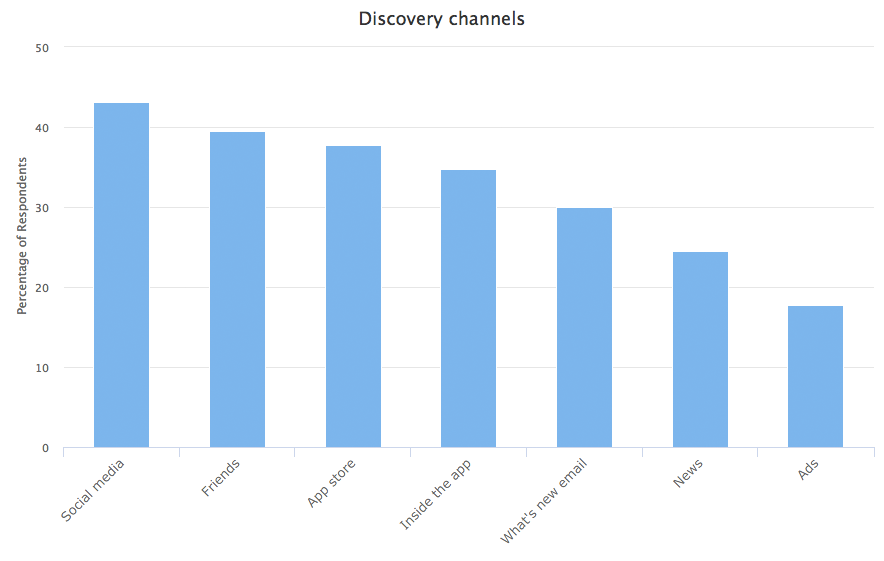
The most common ways users find out about Skills and Actions are through social media, friends, and the device app stores.
We often hear from brands and developers that social media, either paid or organic, is one of the best channels for user acquisition for voice apps. According to the survey, over 43% of respondents found skills through social media. Viral video influencer campaigns are also recommended as they serve two purposes – reach through the influencer, and instruction on how to interact with the voice app. Since it’s a new space and new user interface, users may not know what they can say to, or do with, the particular voice app.
The platforms are trying to improve discovery.
With Alexa, users can ask the device for the latest skills or recommendations, even within categories. The device will walk through a set of Skills, listing the name, and asking if the user wants to install or continue.
In addition, Alexa supports a “can fulfill intent” that developers and brands can implement to help users discover their voice apps. For example, if an Alexa Skill can support ordering a pizza, the developer can list that as a “can fulfill” intent and potentially be recommended by the device when a user asks to order a pizza.
Google Home does not yet appear to have a searchable directory via voice. Asking the device for the latest actions, or recommended actions, results in either the fallback “I don’t understand” type of response, or attempts to provide some form of definition depending on the request – e.g. describing a “sports action” when asking for the latest “sports Actions.”
User satisfaction is high
Users tend to be quite satisfied with their voice devices and recommend them highly.
We asked respondents how satisfied they are with the device’s ability to understand, the device response, and the overall experience. The results are quite positive.
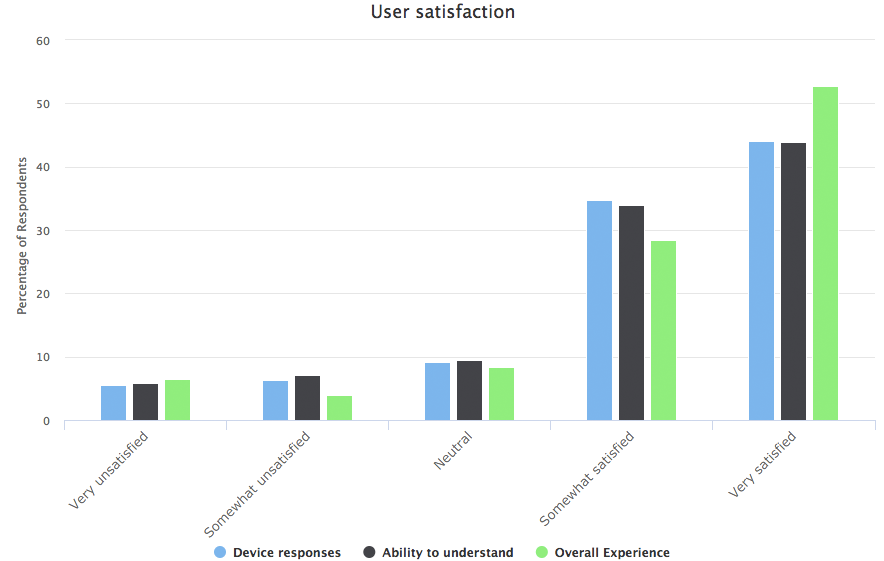
In regards to the device’s ability to understand, nearly 44% of respondents were very satisfied, and an additional 34% were somewhat satisfied. Only about 13% were either somewhat, or very, unsatisfied.
Similarly, in regards to the device reponses, 44% of respondents were very satisfied, and an additional 35% were somewhat satisfied. Only about 12% were either somewhat, or very, unsatisfied.
Based on the overall experience, 53% of respondents were very satisfied and an additional 29% were at least somewhat satisfied. Only 10% were either somewhat, or very, unsatisfied.
In addition, we asked respondents if there was anything about the device that surprised them, and the results also indicate a high level of satisfaction. Owners were surprised by how much the device can do and how knowledgeable the devices are. They mentioned the ease of use, the ability of the device to understand, and how quick and accurate the responses are. Another interesting, and fairly common, comment was how quickly the device updates itself – “every day something new” and “like Christmas everyday.”
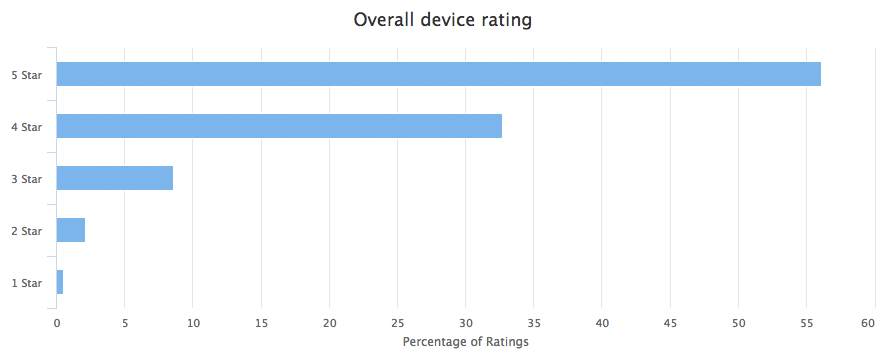
Owners are quite happy with their devices and would happily recommend them. When asked how they would rate the device overall on a one to five star scale, the respondents’ average rating was 4.4 stars.
When asked to rate how likely they are to recommend the device to others on a one to five scale, the respondents rated 4.4 as well.
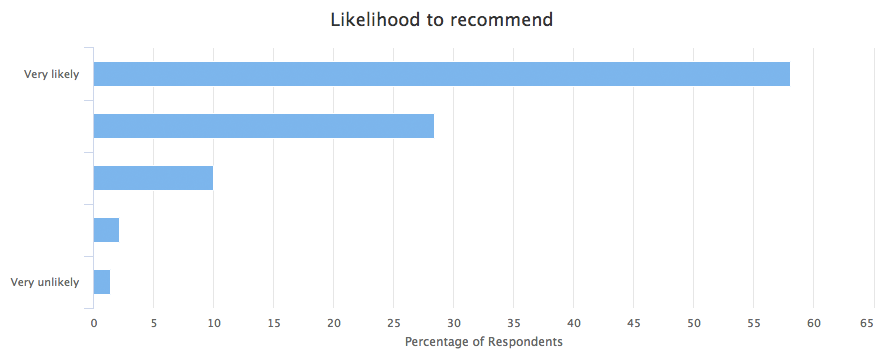
If we look closer at the ratings based on the impact the device has had on behavior, we see overall positive results. For the respondents who said the device has changed their behavior a lot, they rate the devices 4.9 stars and are very likely to recommend the device, with a 4.9 rating as well. Even those users who said the device has not changed their behaviors, still rate the device nearly 4 stars, and are still likely to recommend the devices with a 3.8 out of 5 scale on the likelihood to recommend.
We asked respondents if anything surprised them about the devices and the more common responses were:
- How much the device can do
- How smart the device is and the ability to answer a variety of questions
- The ease of use
- The ability to understand the user’s request
- The user’s dependence on the device and how life changing the device is
- The speed of responses
- The quality of responses
While most of the comments were generally positive, there were a small number of complaints. The biggest complaint, while still a very small number compared to all the positive responses, was the frustration with the device’s ability to understand a user’s request.
Conclusions
Overall, owners of Alexa and Google Home devices are very happy with their devices. They are pleasantly surprised by all the things the devices can do, how smart the devices are, and how reliant they have become on the devices.
While the voice assistant space is still relatively new, there is an opportunity for brands to monetize as there is a strong indication of willingness to make purchases through the devices. As more brands develop voice apps, it will be interesting to see what usecases they support – how they take advantage of the voice interface and whether they implement monetization opportunities.
As many of the respondents mentioned, the devices are continuously getting better – not just in the ability to understand, but in all the functionality provided.
We continue to be bullish on this space and look forward to seeing what the future holds.
About Dashbot
Dashbot is a conversational analytics platform that enables enterprises and developers to increase engagement, acquisition, and monetization through actionable data and tools.
In addition to traditional analytics like engagement and retention, we provide conversation specific metrics including NLP response effectiveness, sentiment analysis, conversational analytics, and the full chat session transcripts.
We also have tools to take action on the data, like our live person take over of chat sessions and push notifications for re-engagement.
We support Alexa, Google Home, Facebook Messenger, Slack, Twitter, Kik, SMS, web chat, and any other conversational interface.